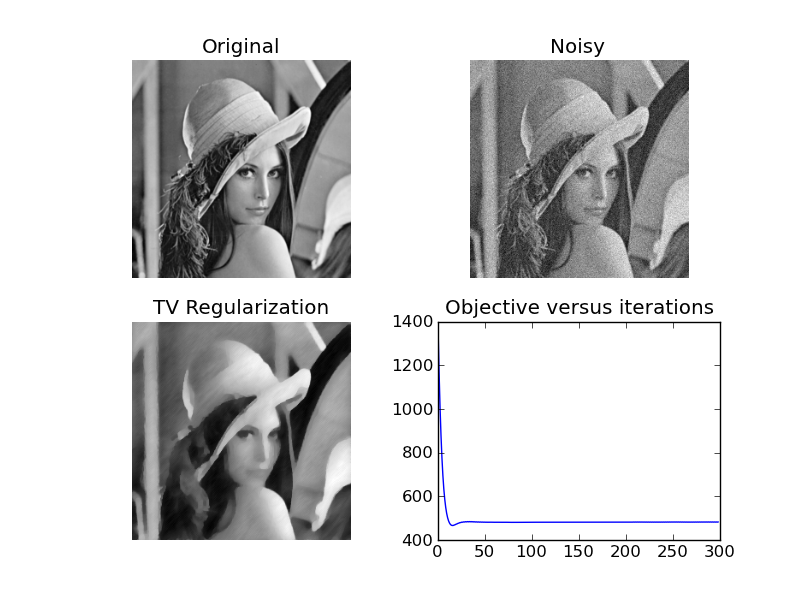
2.1.3. Total variation denoising using Chambolle Pock

Script output:
Performed 300 iterations in 4.42269611359 seconds.
Python source code: plot_tv_denoising_lena.py
# Author: Samuel Vaiter <samuel.vaiter@ceremade.dauphine.fr>
from __future__ import division
from pyprox import dual_prox
from pyprox.operators import soft_thresholding

print __doc__

import time

import numpy as np
import pylab as plt

import pyprox as pp
from pyprox.datasets import load_sample_image

# Load image and convert to a column vector
im = load_sample_image("lena-256")
n = im.shape[0]

# Noisy observations
sigma = 0.06
y = im + sigma * np.random.randn(n,n)

# Regularization parameter
alpha = 0.2

# Gradient and divergence with periodic boundaries
def gradient(x):
    g = np.zeros((x.shape[0],x.shape[1],2))
    g[:,:,0] = np.roll(x,-1,axis=0) - x
    g[:,:,1] = np.roll(x,-1,axis=1) - x
    return g

def divergence(p):
    px = p[:,:,0]
    py = p[:,:,1]
    resx = px - np.roll(px,1,axis=0)
    resy = py - np.roll(py,1,axis=1)
    return -(resx + resy)

# Minimization of F(K*x) + G(x)
K = gradient
K.T = divergence
amp = lambda u : np.sqrt(np.sum(u ** 2,axis=2))
F = lambda u : alpha * np.sum(amp(u))
G = lambda x : 1/2 * np.linalg.norm(y-x,'fro') ** 2

# Proximity operators
normalize = lambda u : u/np.tile(
    (np.maximum(amp(u), 1e-10))[:,:,np.newaxis],
    (1,1,2))
proxF = lambda u,tau : np.tile(
    soft_thresholding(amp(u), alpha*tau)[:,:,np.newaxis],
    (1,1,2) )* normalize(u)
proxFS = dual_prox(proxF)
proxG = lambda x,tau : (x + tau*y) / (1+tau)

callback = lambda x : G(x) + F(K(x))

t1 = time.time()
xRec, cx = pp.admm(proxFS, proxG, K, y,
         maxiter=300, full_output=1, callback=callback)
t2 = time.time()
print "Performed 300 iterations in " + str(t2-t1) + " seconds."


plt.subplot(221)
imgplot = plt.imshow(im)
imgplot.set_cmap('gray')
plt.title('Original')
plt.axis('off')
plt.subplot(222)
imgplot = plt.imshow(y)
imgplot.set_cmap('gray')
plt.title('Noisy')
plt.axis('off')
plt.subplot(223)
imgplot = plt.imshow(xRec)
imgplot.set_cmap('gray')
plt.title('TV Regularization')
plt.axis('off')
plt.subplot(224)
fplot = plt.plot(cx)
plt.title('Objective versus iterations')
plt.show()